It's more important than ever to show data in a way that is clear and interesting. Visualizing facts in a clear way helps people understand your message faster, no matter what field you work in (business, education, healthcare, or public service). Pictogram graphs, which are also called pictographs, are one of the most interesting and easy to use tools.
Unlike most graphs, which use bars or lines to show numbers, pictograms use pictures or symbols instead. This helps people understand the knowledge right away and often makes it more accessible. Let's talk about what pictogram graphs are, how they work, when to use them, and how to make good ones.
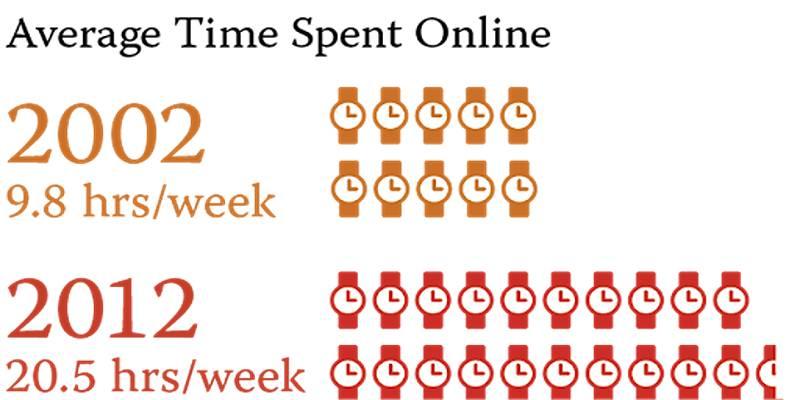
A pictogram graph is a visual chart that uses small repeated icons or images to represent data values. Each icon typically stands for a specific number or quantity. For example, if you're representing the number of books read by students, one book icon might equal five books read.
Instead of using a Y-axis and numeric ticks, pictograms rely on the repetition of these images to communicate data. It's a more intuitive and human-friendly way of presenting numerical information—especially helpful for kids, casual readers, and non-technical audiences.
Creating an effective pictogram graph goes beyond placing icons next to numbers. To design a clear and informative pictograph, the following elements must be considered:
Well-designed pictogram graphs take the viewer’s attention span and visual processing habits into account, making them a powerful medium when properly executed.
Pictograms are ideal when you need to:
Because they rely on symbolic imagery, pictogram graphs are especially effective in contexts where emotional connection or quick recognition is crucial. Campaigns, posters, surveys, and even resumes can benefit from the human touch pictograms provide.
Here’s a step-by-step guide to help you design your own pictogram graph:
Step 1: Choose the Right Data
Start with straightforward data—pictograms aren’t suited for highly complex or multilayered datasets. The simpler your data, the more effective your pictogram will be.
Step 2: Select a Relevant Icon
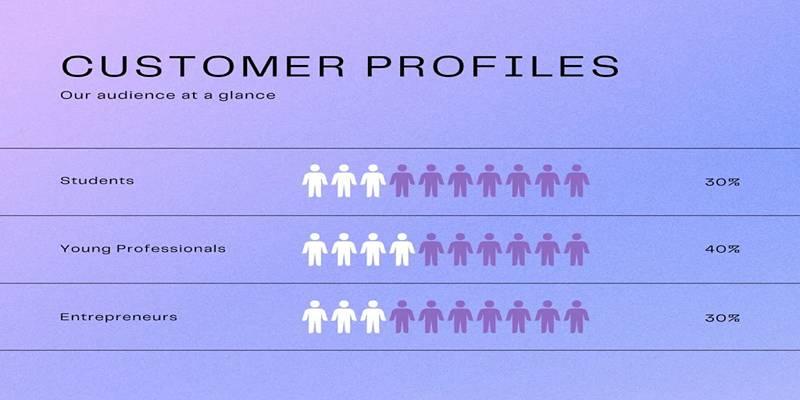
Pick icons that visually match the subject of the data. For example, if the topic is about book sales, use book icons. If you’re showing population statistics, use people icons. The more contextually aligned your icons are, the easier it is for your audience to understand the chart.
Step 3: Set the Value for Each Icon
Decide what numerical value each icon will represent. This is critical for ensuring consistency across the chart. Also, avoid overly small values that would require hundreds of icons.
Step 4: Arrange Icons Clearly
Icons should be placed in neat rows or grids, like a 5x5 or 10x10 layout. This makes it easier for viewers to count or estimate totals. Avoid randomly placed icons—they reduce readability.
Step 5: Add Labels and Titles
Make sure to include a clear title and labels that describe what the data is about. Add a legend that states what each icon represents. Without labels, even the best design can lose its meaning.
Step 6: Use Color Thoughtfully
If comparing categories, use different shades or colors, but keep it subtle. Overly bright or clashing colors can make your graph look unprofessional and confusing.
Step 7: Review for Clarity
Ask someone else to interpret your pictogram before finalizing it. If they can understand the data quickly without explanation, your graph is likely effective.
By following these steps, even beginners can create compelling pictogram graphs that communicate data with clarity and impact.
These practices help maximize the readability, usability, and aesthetic quality of your pictogram graph.
A pictogram graph is more than just a pretty picture—it’s a powerful data visualization tool that combines clarity, simplicity, and visual storytelling. By transforming numbers into icons, pictograms help audiences absorb information faster and retain it longer.
To make the most out of this tool, it’s essential to understand when to use it, how to design it correctly, and how to avoid common pitfalls. Whether you're presenting to students, stakeholders, or the general public, pictogram graphs offer a fresh, intuitive way to make data come alive—and stick in the viewer’s mind long after the graph disappears.

How does Qualcomm's latest AI startup acquisition reshape its IoT strategy? Here's what this move means for edge intelligence and smart device performance

To decide which of the shelf and custom-built machine learning models best fit your company, weigh their advantages and drawbacks

Know how to produce synthetic data for deep learning, conserve resources, and improve model accuracy by applying many methods

Generate your OpenAI API key, add credits, and unlock access to powerful AI tools for your apps and projects today.

How leveraging AI into your business can help save time, reduce repetitive tasks, and boost productivity with simple, smart strategies

Knowledge representation in AI helps machines reason and act intelligently by organizing information in structured formats. Understand how it works in real-world systems

Nvidia Acquires Israeli AI Startup for $700M to expand its AI capabil-ities and integrate advanced optimization software into its platforms. Learn how this move impacts Nvidia’s strategy and the Israeli tech ecosystem

AI changes the workplace and represents unique possibilities and problems. Find out how it affects ethics and employment

AI in wearable technology is changing the way people track their health. Learn how smart devices use AI for real-time health monitoring, chronic care, and better wellness

Boost your Amazon sales by optimizing your Amazon product images using ChatGPT. Learn how to craft image strategies that convert with clarity and purpose

Can artificial intelligence make us safer? Discover how AI improves security, detects threats, and supports emergency response

The Black Box Problem in AI highlights the difficulty of understanding AI decisions. Learn why transparency matters, how it affects trust, and what methods are used to make AI systems more explainable